Score Converter

The Basic Idea
Psychologists (especially those of us in neuropsychology) spend much time deriving and interpreting cognitive test scores. As test publishers vary in the form of derived score offered (e.g., \(Z\)-, \(T\)-, Scaled- Scores etc.) clinicians are routinely required to work with multiple metrics. It has been suggested that converting test scores to a unified metric may aid interpretation (Crawford, 2013), tabulation, and visualisation of test scores. Conversion between any pair of standardised metrics can be done using the following equation Equation 1.
\[ X_{new} = \frac{s_{new}}{s_{old}} (X_{old} - \bar{X}_{old}) + \bar{X}_{new} \tag{1}\]
Where \(X_{new}\) is the newly converted (or derived) score, \(s_{new}\) and \(s_{old}\) refer to the SD value for both new and old metrics, \(\bar{X}_{new}\) and \(\bar{X}_{old}\) are the mean value for the new and old metrics, and finally \(X_{old}\) is the original standard score.
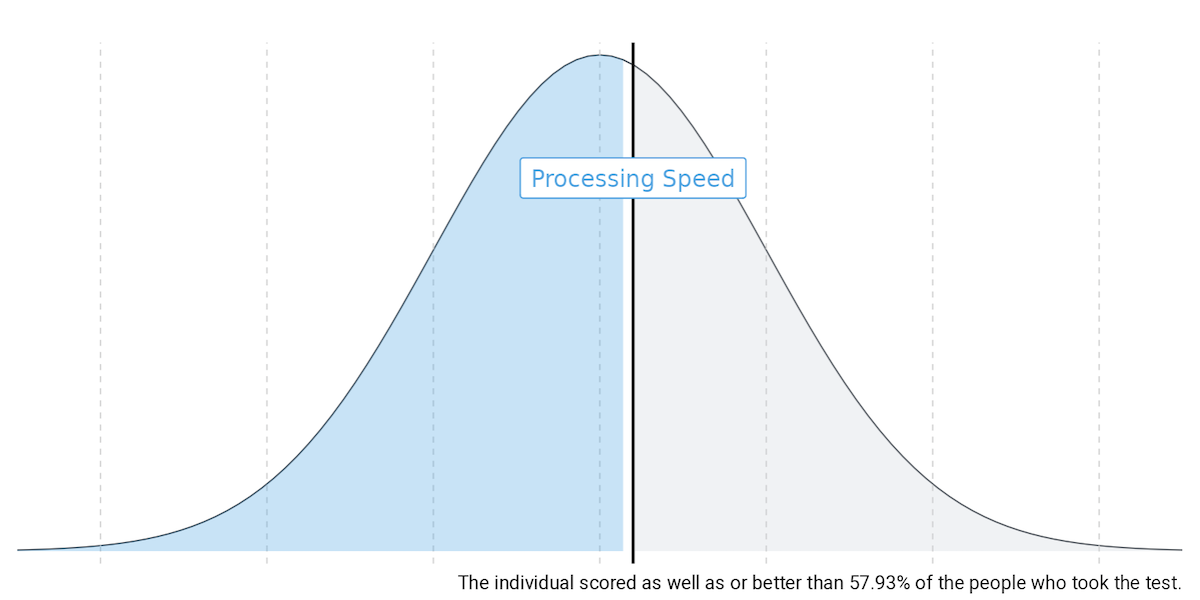
Unfortunately, manual conversion of scores is error-prone, imprecise, and time-intensive. Electronic tools are required for streamlining these processes and providing ease of access to visualisation functionality. Score Converter is a html app that allows users to convert single test scores (using a web interface) or large batteries of test results (using spreadsheet upload). A variety of derived score types and descriptor systems are included, providing the user with the ability to develop customised test score summary tables. A suite of visualisation tools is provided for plotting test score data, including forest plots, bar plots, bell-curves, and radar plots. All output produced can be exported to csv, pdf, or png files.
Score Converter provides an efficient and comprehensive range of features for converting, tabulating, and visualising test scores. Future empirical research needs to explore how visualisation and tabulation tools can aid, influence, or hinder the process of interpreting neuropsychological test data.
The application is embedded as an iframe (see below) however it is recommend that users access the app via the host website here.
If you like the app, consider sharing it with others?
App
Poster
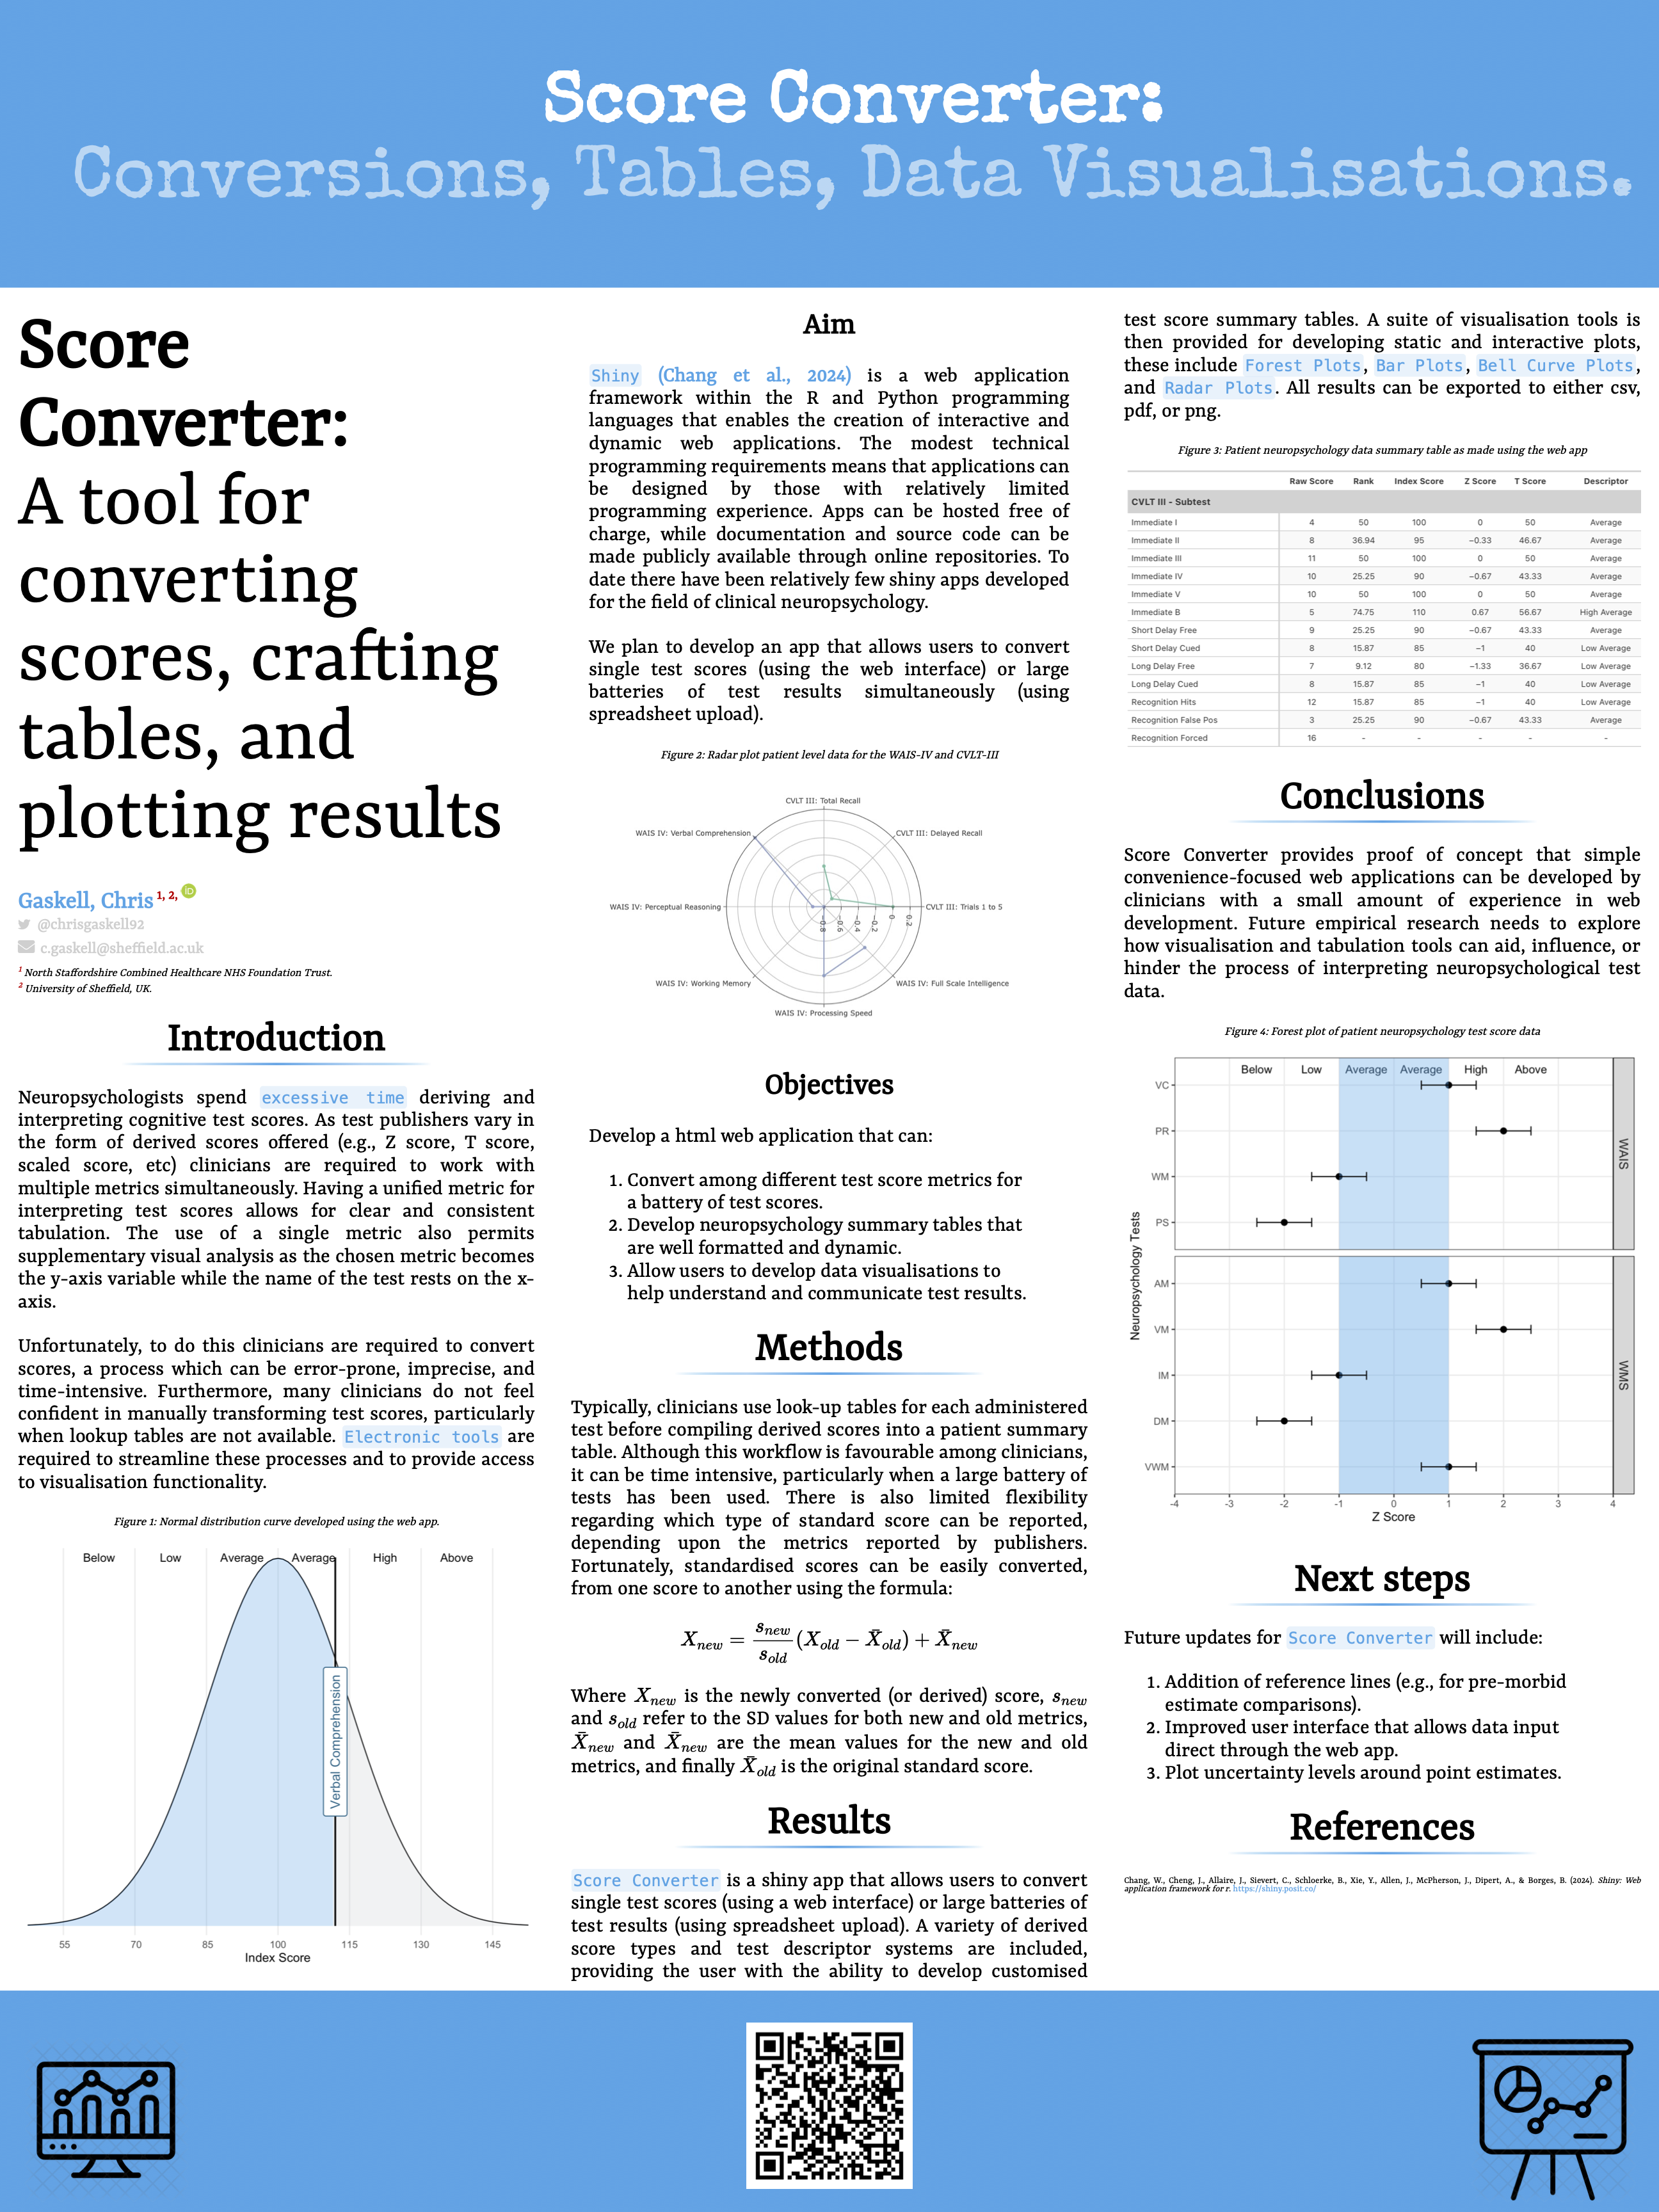
I also presented this as a virtual poster at the 21st NR-SIG-WFNR1 (see screenshot below).

References
Footnotes
Neuropsychological Rehabilitation Specialist Interest Group for the World Federation for NeuroRehabilitation↩︎